If you are not a programmer, but do want to use the API in a low code environment or if you just want get a quick feeling of what the API is capable of, you may want to use the API from a spreadsheet. This post will guide you through the steps to get this done using a Google Spreadsheet. A Similar method, using Microsoft Excel is also available. In order to use the below method, you must have access to Google Drive, through a Google (Gmail) account.
Before you continue, you should note that is not a very safe method for use in production environments as it does not provide any way to properly protect your API Key from being shared with others.
Getting the template
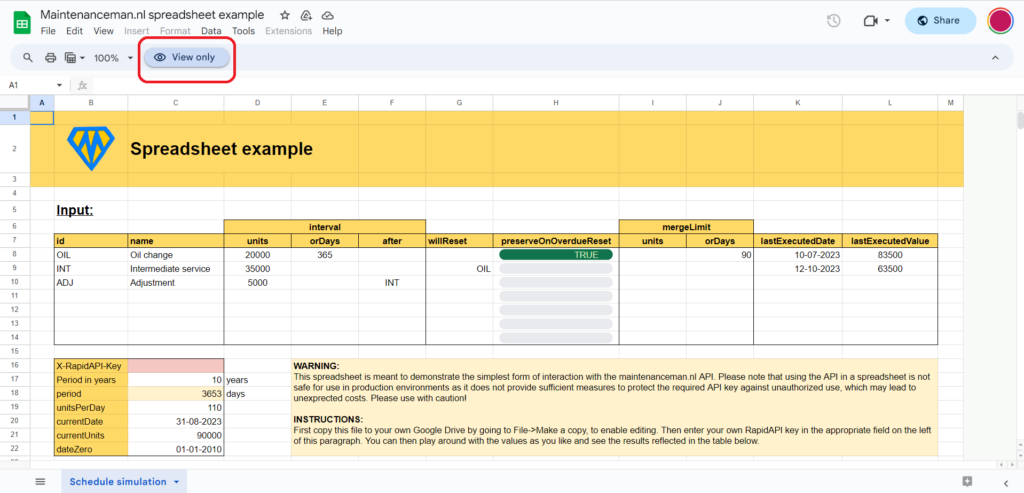
For your convenience, we have prepared a template document that you can copy to your own Google Drive and which you can find here. You can just click the link to open the document in your browser. This will open the spreadsheet as shown in the below image, in ‘View only‘ mode.
Of course you will not be able to make any changes to this document. In order to use the spreadsheet, you will have to copy it to your own Google Drive. This is done by clicking ‘File‘ in the menu bar and then clicking ‘Make a copy‘ in the File menu.
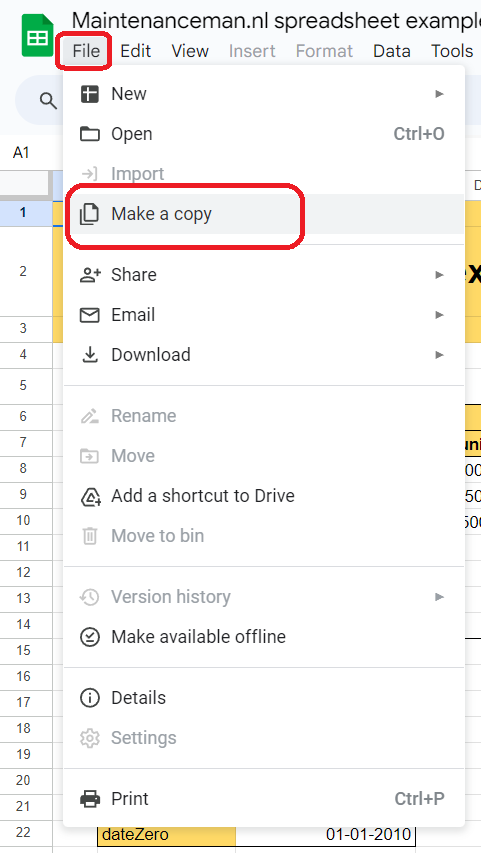
Please note that you will need to be already logged into your Google account in order for the ‘Make a copy’ menu item to be enabled. Otherwise this menu item will be greyed out. Once you have clicked on the ‘Make a copy’ menu item, the below displayed dialog will appear.
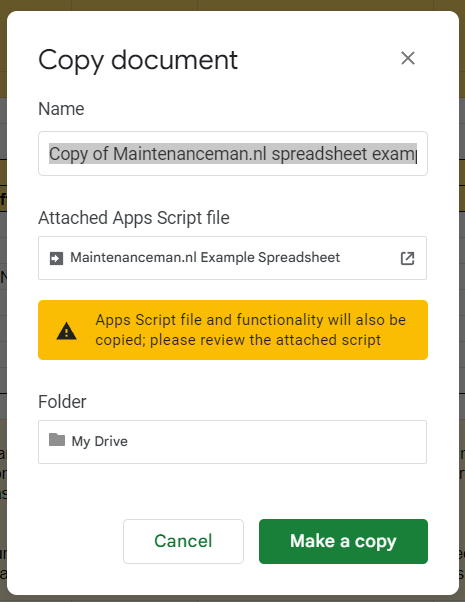
In the first field you can change the name to use for the Spreadsheet to be stored on your own Google Drive. By default this will be ‘Copy of Maintenanceman.nl spreadsheet example‘, but you can change it to any name you might desire. Also you will get a warning about an ‘Apps Script file and functionality’ that will be copied with the document. This is the script that will take care of transforming the inputted values in the spreadsheet to a valid API call and displaying the API Call response. It has only one custom function named ‘scheduleAPI’ which is used in cell B27 of the spreadsheet. Without this, the spreadsheet will not work.
If you want to review the content of the script, you can click the little ![]() icon to the right of the script file name. If you are familiar with JavaScript, the content should be self explanatory. Also you can amend the script to your likings after copying the spreadsheet to your own Google Drive.
icon to the right of the script file name. If you are familiar with JavaScript, the content should be self explanatory. Also you can amend the script to your likings after copying the spreadsheet to your own Google Drive.
Finally you can click the green ‘Make a copy’ button and the copied file will open in a new tab in your browser.
Entering your API Key
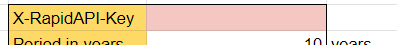
The final thing that needs to be done before you can actually start using the spreadsheet is entering your API Key. This is the X-RapidAPI-Key that you can find in your RapidAPI.com account after subscribing to the Maintenanceman.nl API there, as described in the ‘Getting Started‘ tutorial. You can enter this key in the appropriate field in the spreadsheet. As the spreadsheet already contains some sample data, the results table at the bottom should start displaying some sample results immediately. Otherwise this will only contain a message saying ‘Invalid API key. Go to https://docs.rapidapi.com/docs/keys for more info.’.
Please note that, as soon as you have entered a valid API Key, each change to the spreadsheet’s input fields will automatically initiate a new API call, which will be charged according to the billing plan you have chosen. If you need to update more fields and you don’t want to make any intermediate API calls while editing, it is therefore recommended to temporarily remove the API key to avoid excess charges. If you are on a free plan, you obviously do not have anything to worry about, but even then you might want to avoid reaching the request limit.
Dissecting the example input
Now that we’re up and running, let’s look at the example input. The main input table contains the rules that your maintenance schedule is built from and exists out of five main sections. From left to right, the first section contains two columns that are used to identify the maintenance schedule rule. The Id field needs to be a unique identifier that may be used in other rules to refer to the current one. The ‘name’ field is only there for readability and contains a recognisable description of the rule.
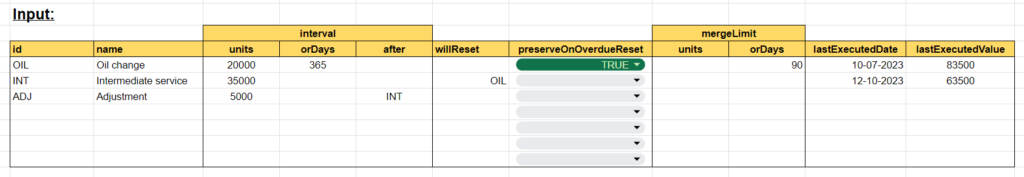
The second section specifies the interval at which the maintenance schedule rule should be executed. This can be specified in a measure of use (i.e. a mileage, running hour measurement, or any other countable value that may indicate a need for maintenance.) or in a number of calendar days. This is specified in the columns ‘units’ and ‘orDays’. If both columns contain a value, the API will determine which one will occur first and use that for the output. The third column in the interval section named ‘after’ allows you to execute a rule only once, at X units after another rule is executed. The ‘after’ column should contain the ‘id’ of the rule that triggers the current rule. You can specify multiple id’s by separating them by comma’s.
The third section will manage possible resets of other schedule rules. This is done by entering the id’s of the rules to be reset in the ‘willReset’ column, separated by comma’s. Resetting a schedule rule means that the interval will restart counting from zero. This is particularly useful when a maintenance schedule rule includes the scope of another rule. The ‘preserveOnOverdueReset’ value can be either true or false and specifies how to handle resets of the current rule when the resetting rule is overdue. You can read more about that in this post.
The fourth section named ‘mergeLimit’ will allow you to specify the minimal gap to the next rule that will reset the current one. E.g. if your asset is due for an oil change, but a complete overhaul of the asset is less than 90 days away, you probably want to postpone the oil change. This is explained more thoroughly in my post about reset prevention and merging.
The final section specifies the actual current state of maintenance with the last execution date and value. The lastExecutedValue field course refers to the same unit of measure as the ‘units’ field in the ‘interval’ section.
To summarize the above, looking at the first rule in the example you see that it has ‘OIL’ as its unique identifier and it specifies an oil change that should be executed every 20000 units (km, miles, running hours, etc.) or every 365 calendar days. Whichever comes first. Also you see that the last actual execution of this rule took place on July 10th, 2023 at 83500 units. The second rule has ‘INT’ as unique identifier and specifies an intermediate service that has an interval of 35000 units, includes the scope of an oil change and therefore must reset ‘OIL’. The third rule specifies an adjustment that must be executed 5000 units after the intermediate service.
Although the example table only has seven rows, please note that you can extend the table to as many rows as you may require.
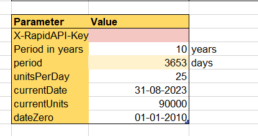
The second input table on the sheet, that you have already encountered while filling in the X-RapidIPA-Key, contains the general data of your query. Form top to bottom the input fields in this table are:
- X-RapidAPI-Key:
this is the API Key required for communication with the API server. - Period in years:
defines the time span for which you want to make your prediction. Please note that this value is automatically limited to 50 years. - period:
same as Period in years, but converted to days, because time measurement in the API is done in days. - unitsPerDay:
the average daily increase to assume for the measure of use that you defined for this schedule (km, miles, running hours, etc.). This is one of the main values to play with when simulating different scenario’s. - currentDate:
The most recent date that the measure of use (see: currentUnits) has been recorded. This does not necessarily have to be today’s date. - currentUnits:
the last known value for the measure of use. - dateZero:
the date of the first operation of the asset (if known). If this is left blank, the API will assume a date based on the other input.
Dissecting the results
Finally, at the bottom of the sheet you will find the results table as shown below. The table will show a simulation of all future maintenance actions to be performed in chronological order, following the schedule that was defined earlier in this post. The columns in the results table will look familiar as these were previously provided with the input data. From left to right we first encounter the ‘id’ and ‘name’ field which of course refer to the previously defined maintenance rules. Then we see the ‘value’ column, which will hold the ‘measure of use’ value (km, miles, running hours, etc.) at which a certain maintenance action ought to take place and next to that is the corresponding calendar date. The final three columns ‘year’, ‘dueAt’ and ‘dueDate’ are included for convenience. The ‘year’ column represents the year of the execution date. The ‘dueAt’ and ‘dueDate’ are only filled when a certain service interval is overdue and respectively represent the measure of use and the date at which the service should have been executed.
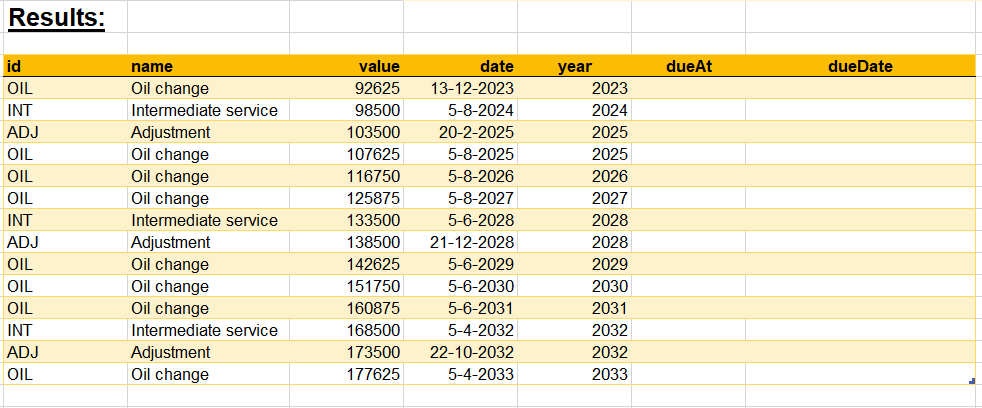
In the above example, you can see that the different types of services are predicted on regular intervals until the end of the specified simulation period. Because we specified the ‘Oil change’ to be executed at least every 365 days, and the unitsPerDay value does not reach the use based interval for the ‘Oil change’ within that period, the oil changes are just planned on an annual interval. Increasing the ‘unitsPerDay’ input value, will demonstrate the execution dates to come closer together when the value is increased and from a value of 55 units, the annual oil change interval will change to a used base interval accordingly.
Happy scheduling!
To wrap up the above; you can make as many copies of the original spreadsheet as you like. Also you can perform any normal Google Spreadsheet action on the results table like creating a pivot table or VLOOKUP values.
Finally you have probably noticed the odd looking names for input fields like ‘unitsPerDay’ and ‘orDays’. These names are deliberately stated like this to be the same as the JSON field names in the actual API call that is made in the background. This facilitates a smoother transfer when you decide to use the same API in a more advanced solution like an ERP system or software.